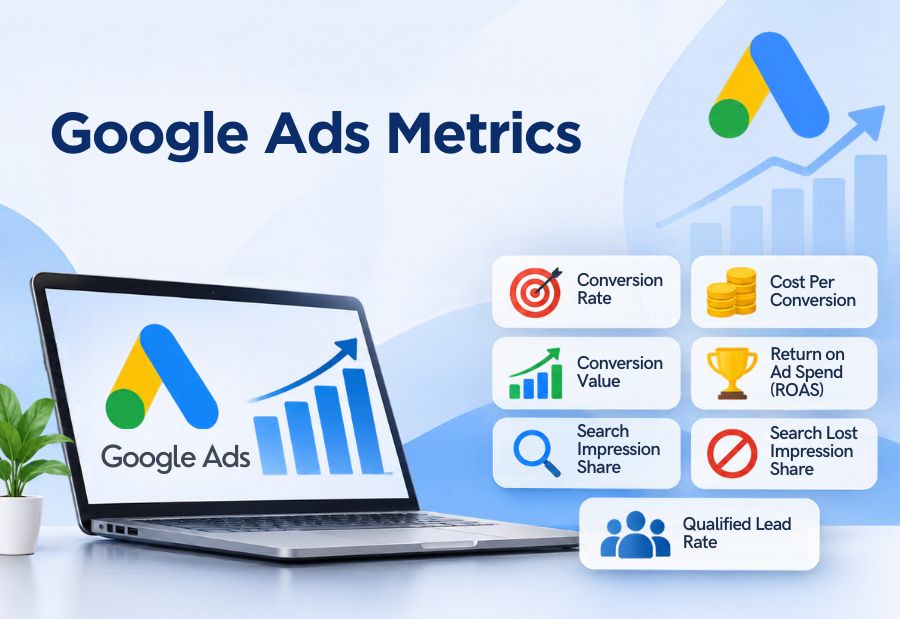
7 Google Ads Metrics That Matter Beyond Clicks and Impressions
Clicks and impressions are two of the most visible numbers in a Google Ads report, but they do not always show whether a campaign is delivering business results. For B2B marketers, understanding what happens after someone clicks an ad is just as important as attracting website traffic. Platforms such as Google Ads and HubSpot can help marketing teams connect campaign activity with lead generation and sales outcomes.
Tracking the right Google Ads metrics helps businesses understand campaign efficiency, lead quality and return on advertising investment. Instead of focusing only on traffic, marketers should evaluate whether their campaigns are attracting relevant audiences and generating valuable actions.
1. Conversion Rate
Conversion rate measures the percentage of ad interactions that result in a desired action, such as a form submission, phone call, purchase or demo request.
A high number of clicks may look positive, but a low conversion rate can indicate that visitors are not finding what they expect after clicking an ad.
For example, if a campaign receives 500 clicks and generates 25 form submissions, its conversion rate is 5%.
Why it matters: It helps marketers understand whether their ads, targeting and landing pages encourage users to take action.
To improve conversion rates:
- Match landing page content with the ad message.
- Use clear calls to action.
- Keep lead forms simple.
- Review mobile page experience.
- Test different headlines and landing page layouts.
2. Cost Per Conversion
Cost per conversion shows how much a business spends, on average, to generate one conversion. It helps marketers evaluate whether campaign results are being achieved within the available budget.
For example, if a campaign spends ₹20,000 and generates 40 conversions, the average cost per conversion is ₹500.
However, a low cost per conversion does not automatically mean better performance. A campaign generating inexpensive but irrelevant enquiries may create additional work for the sales team without contributing to revenue.
Why it matters: It helps businesses compare campaign efficiency while considering the value and quality of the conversions generated.
3. Conversion Value
Conversion value assigns a monetary or business value to specific actions generated through advertising.
Not all conversions contribute equally to business growth. For example, a product purchase, a qualified demo request and a newsletter subscription may have different levels of commercial value.
Businesses can assign suitable values to conversion actions and use this information to understand which campaigns are generating more valuable outcomes.
Why it matters: Conversion value helps marketers move beyond counting leads and evaluate the business contribution of their advertising campaigns.
For B2B campaigns, businesses can connect CRM data with advertising reports to understand which enquiries progress into qualified opportunities.
4. Return on Ad Spend (ROAS)
Return on Ad Spend measures the conversion value generated for every unit of advertising spend.
The formula is:
ROAS = Conversion Value ÷ Advertising Cost
For example, if a campaign generates ₹1,50,000 in tracked conversion value from an advertising spend of ₹30,000, its ROAS is 5x.
This means the campaign generated ₹5 in conversion value for every ₹1 spent.
Why it matters: ROAS helps businesses understand the financial efficiency of campaigns, particularly when conversion values are tracked accurately.
For lead generation campaigns, marketers should avoid treating every form submission as equal revenue. Assigning realistic values to qualified leads and sales outcomes can provide a more meaningful picture.
5. Search Impression Share
Search Impression Share measures the percentage of eligible search impressions that an ad actually receives.
For example, if an ad receives 600 impressions out of 1,000 eligible impressions, its Search Impression Share is 60%.
A lower share may indicate that a campaign is missing opportunities because of budget limitations, Ad Rank or other eligibility factors.
Why it matters: This metric helps marketers understand how much of the available search opportunity their campaigns are capturing.
Reviewing Search Impression Share alongside budget and ranking information can help identify whether campaigns need budget adjustments, improved ad relevance or stronger landing page experiences.
6. Search Lost Impression Share
Search Lost Impression Share shows the estimated share of eligible impressions a campaign misses because of budget or Ad Rank limitations.
Google Ads provides separate reporting for:
- Search Lost IS (Budget): The estimated impression share lost because the campaign budget was insufficient.
- Search Lost IS (Rank): The estimated impression share lost because of Ad Rank limitations.
These metrics help identify why a campaign may not be appearing as often as expected.
Why it matters: They provide direction for campaign optimisation. If budget limitations are the main issue, marketers can review spending priorities. If Ad Rank is the issue, they can evaluate bids, ad relevance and landing page quality.
7. Qualified Lead Rate
For B2B businesses, generating leads is only one part of the marketing process. The next step is understanding how many of those leads meet the sales team’s requirements.
Qualified Lead Rate measures the percentage of generated leads that are considered suitable for further sales engagement.
The formula is:
Qualified Lead Rate = (Qualified Leads ÷ Total Leads) × 100
For example, if a campaign generates 100 leads and 30 meet the business’s qualification criteria, the Qualified Lead Rate is 30%.
This metric is particularly useful for businesses running campaigns for specialised services, high-value products or long sales cycles.
Why it matters: It helps marketing teams evaluate whether their targeting and messaging are attracting the right audience rather than simply increasing enquiry volume.
Businesses can improve this metric by refining audience targeting, using relevant landing page content and sharing lead feedback between marketing and sales teams.
How to Use These Metrics Together
No single metric can provide a complete picture of Google Ads performance. Marketers should review multiple indicators to understand the relationship between campaign spending, traffic, conversions and business outcomes.
For example:
| Campaign Objective | Metrics to Prioritise |
| Lead generation | Conversion rate, cost per conversion, qualified lead rate |
| Online sales | Conversion value, ROAS, cost per conversion |
| Search visibility | Search Impression Share, Search Lost IS |
| Campaign efficiency | Conversion rate, cost per conversion, ROAS |
A regular performance review can help identify campaigns that need better targeting, improved landing pages or changes to budget allocation.
For businesses managing multiple campaigns, Mercadeo can help connect campaign reporting with broader B2B marketing and lead generation objectives. The focus should be on understanding which activities contribute to meaningful business results.
Final Thought
Clicks and impressions are useful indicators of advertising reach, but they should not be the only measures of success. Conversion rate, cost per conversion, conversion value, ROAS, impression share and qualified lead rate provide a deeper understanding of campaign performance.
By tracking the right Google Ads metrics, businesses can make more informed decisions, improve advertising efficiency and focus their budgets on campaigns that contribute to better marketing and sales outcomes.
About The Author
